In a recent post titled, “What happened to the distribution of real earnings during the recession?”, Stephen Gordon presents a graphs that shows some significant growth in real (adjust for inflation) earnings in Canada between 2007 and 2012. In addition, plotting average annual growth rates in real earnings against the distribution of earnings, the graph has a U shape. That is, the growth rates of real earnings are higher for those at or near the bottom and those at or near the top of the earnings distribution, with a “hollowed-out” middle.
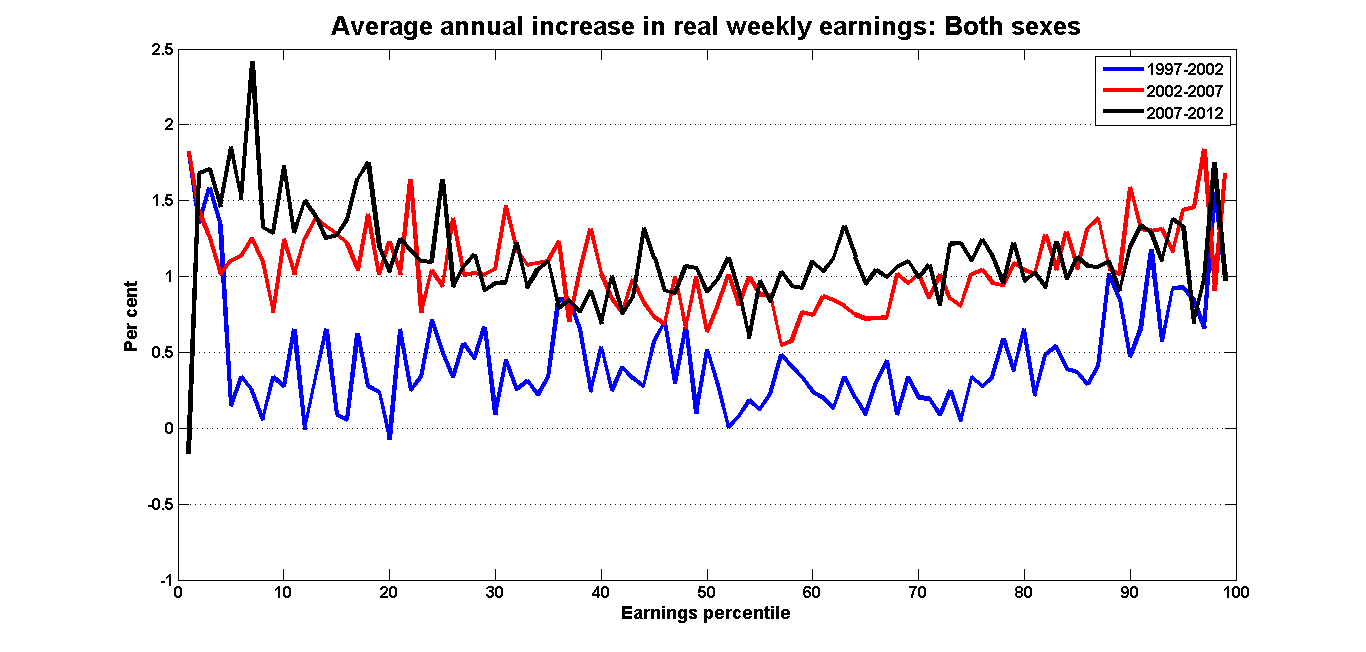
This graph, as well as several others presented by Gordon in this post and a previous article that show some sustained general growth in real earnings, goes against the received wisdom that real earnings have been stagnant, in Canada and across the world, for the past 30 or 40 years – especially so for low earners. What is behind the discrepancy between this new data and the long-standing trend? Gordon claims it is lower-than-expected inflation and, if not the active, then at least the passive policy of the Conservative government. I take issue with these claims.
Gordon’s chief explanation for the recent growth in real earnings is that inflation has been below expectations since the financial crisis. It has been lower than the Bank of Canada’s 2% target rate due to the Bank’s own attempts to revive the economy via near-zero interest rates. Since wages are “sticky”, meaning that they adjust slowly to changing economic trends, they will continue to increase in nominal terms even if inflation drops off. This causes real wages to increase. Yet although inflation has been largely near or below the 2% target rate since 2007, it has only been an average of 0.3% lower per year than the long-term trend since 1990. This is not a reduction large or sustained enough to explain the left, low-wage side of the U shape in Gordon’s data.
So what could be behind rising real wages for the lowest earners? Certainly, the federal government has not pursued a high-wage, high-employment strategy since (or before) the crisis. Although unemployment has dropped slightly, the percentage of employed Canadians has remained stagnant and not recovered since the crisis as many have left the workforce altogether. Of the jobs that are being created the vast majority are part-time, often precarious and in low-wage sectors. Corporate tax cuts have only helped companies build piles of cash as investment lags. Public services and public jobs are being cut – Canada Post being just the latest in a long string of examples. Finally, unions, which help workers, especially those in average-paying jobs, achieve better pay and working conditions, are under increasing attack with several damaging bills in the works.
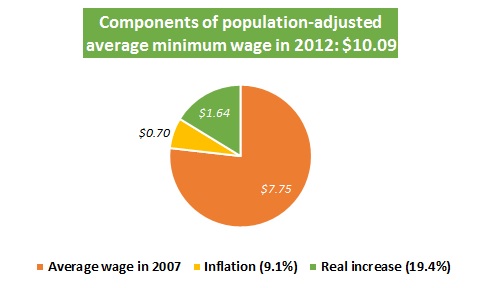
It seems that Gordon is implicitly praising the wrong level of government. Between 2007 and 2012, Canada’s provincial and territorial governments raised minimum wages a cumulative 73 times, an average of almost once per year for each province and territory. Over these six years, minimum wages increased from between $6.70 and $8.50 to between $9.75 and $11.00. That’s an average increase of $2.35 when the data is adjusted to reflect the population of each province and translates into an average 30.3% increase in the minimum wage over those six years, again adjusting for the relative size of provinces.
Inflation, on the other hand, was 9.1% over the same six-year period. This means that minimum wages grew more than three times as fast as inflation. As a result, real wages grew by 19.4% for minimum wage workers. This is an average real annual increase of an even 3%.
The nation-wide percentage of employees earning minimum wage increased between 2000 and 2009 from 4.7% to 5.8%. More recent national data is not publicly-available but the latest figure for Ontario is even higher at 9% in 2011. While, based on past trends, the national figure is almost certainly lower, it has also almost certainly grown further since 2009. Let us conservatively put it around 6 to 7% in 2012 – or about two-thirds of the bottom decile of income-earners.
Since Gordon’s graph shows around a 1.5-2% increase in real earnings for the lowest 10% of earners, this means that minimum wage increases account for pretty much the entirety of this increase. In addition, since minimum wages have increased so significantly, a number of jobs that paid relatively little above minimum wage also experienced wage increases, even in nominal terms. An $8.50 per hour job in 2007 is now at least a $10 per hour job and likely slightly better – this too is a real earnings increase. Finally, the minimum wage is a kind of reference wage for low-wage work in that there are some jobs that pay not much above the minimum and in which wages may also go up as a result of increases in the minimum wage in order to differentiate them from minimum wage jobs and maintain the previous hierarchy (although an increase in the minimum wage may also lead to greater wage compression in the middle of the wage scale). Real earnings increases for these last reasons may account for a large portion of the remaining low-earnings side of the U curve in Gordon’s graph.
That minimum wage increases explain the real earnings growth by low-wage workers after 2007 is bolstered by opposite trends in both minimum wages and real earnings before 2007. In the decade between 1997 and 2006, the minimum wage grew from a population-weighted average of $6.43 to $7.75. This $6.43 adjusted for inflation – which amounted to 21% over the decade – also equals $7.75 in 2006. In other words, there was no real growth in the minimum wage during this period: legislative increases exactly covered inflation, but not a penny more.
The other side of the U on Gordon’s graph is more in line with the typical explanations of economic changes during the past 30 to 40 years that have seen income from all sources become more concentrated at the top through a variety of means. In terms of earnings, this has meant higher growth of managerial and professional salaries and other earnings compared to lower-paid work. That these have grown more rapidly relative to others is also borne out in the Canadian data.
The other aspect of Gordon’s provocative earnings data I want to briefly touch upon is the generally higher growth in real earnings he observes since 2007. UBC’s Kevin Milligan has used his blog to point out some methodological issues with Gordon’s approach. The main concern is whether to use self-reported data from employers and workers on wages and hours or official tax data. Gordon employs the former. As such, his data may have upward biases due to self-presentation: both workers and employers may want to present themselves as respectively making and providing better pay than in reality.
Milligan, on the other hand, uses tax data and looks only at full-time workers. With this method, he finds that the established pattern of stagnant real earnings growth for all but those at the top of the income distribution still applies. Furthermore, Milligan does not find the same increase in real earnings for low-income earner. This makes sense given his restriction to full-time workers as minimum wage earners work predominantly part-time.
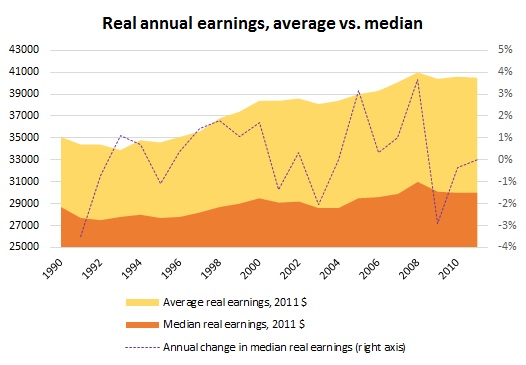
Finally, the use of the average rather than the median overstates the growth of earnings as the average is naturally skewed upwards on a scale such as earnings which is naturally bounded at the low end (by zero or the minimum wage) and theoretically unbounded at the high end. The graph below shows the differences in the growth of median and average real earnings using tax data but without Milligan’s limitation to full-time workers.
The biases listed above combined with the effect of lower-than-expected inflation are enough to explain the remaining differences between Gordon’s data and the standard picture, especially once the effects of minimum wage increases are also factored in.
While the crisis has led to the growth of real earnings in Canada, this growth has been unequally distributed, especially among full-time workers. Those at the very bottom of the earnings distribution have been the beneficiaries of legislated minimum wage increases enacted by provincial and territorial governments. These increases have been a rare positive light on the Canadian job market. Alongside selective earnings growth, the crisis has also led to fewer stable, full-time jobs, large job losses in sectors such as manufacturing and an increase in discouraged workers. Progressive legislation – like that which raises minimum wages faster than inflation – can have effects that translate to gains for workers, including the lowest-paid, but it has to be part of a consistent program to truly make a difference. The Conservatives have not casually presided over a lucky improvement in working conditions; instead, they have been lucky that other institutions have simultaneously countered some of their labour market damages.
2 replies on “Legislating a real raise: Minimum wages and real earnings growth”
[…] This new data is quite different from studies quoted by Gordon, which purport to show either a lack of change or an increase in poverty rates after a raise in the minimum wage. To do so they use outdated methodology or speculative simulations, which further erroneously assume that employment falls due to minimum wage increases. One study also argues that minimum wage increases will contribute to greater inequality – another questionable finding given the results of Dube’s poverty rate studies and the evidence for wage compression found in the new employment studies (some previous related thoughts of mine on this topic here. […]
[…] This new data is quite different from studies quoted by Gordon, which purport to show either a lack of change or an increase in poverty rates after a raise in the minimum wage. To do so they use outdated methodology or speculative simulations, which further erroneously assume that employment falls due to minimum wage increases. One study also argues that minimum wage increases will contribute to greater inequality – another questionable finding given the results of Dube’s poverty rate studies and the evidence for wage compression found in the new employment studies (some previous related thoughts of mine on this topic here. […]