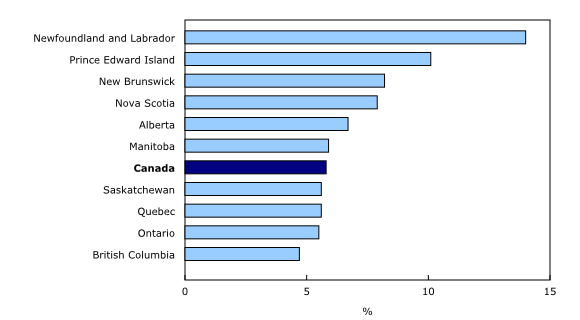
We’ve had two months of jobs data in Canada since Ontario increased it’s minimum wage from $11.60 to $14 on January 1, 2017. When January’s Labour Force Survey numbers came out and showed some of the biggest month-over-month losses in years, there was a slew of predictable, reflexive commentary blaming Ontario’s minimum wage hike. Now that we have a second month of data that show modest job gains as well as falling unemployment, down to 5.8% nation-wide and 5.5% in Ontario, the same critics are silent. The lesson is that they should have also been silent about January’s numbers.
Simply put, we don’t know enough to lay the blame for good or bad jobs numbers at the feet of a minimum wage hike in Ontario. Both January’s negative data and February’s positive data should give us pause. The monthly jobs data are volatile. The drop in January was so out of line with long-term trends that it raised the eyebrows of nearly all economists. Part of January’s losses are due to the typical rash of post-holiday lay-offs. But these numbers also seem at least in part statistical error rather than a reflection of something happening in the real world, especially when compared with February’s return to the trend of consistent, if modest, job growth.

What’s more, January showed drops largely concentrated in higher-paid industries, not the service industries where minimum wage work is most prevalent, came after months of with some unexpectedly large gains, and showed drops across provinces, including those with no minimum wage increases. In fact, Ontario and Quebec were not too dissimilar in January’s jobs numbers: Quebec’s unemployment actually rose by more month-to-month, while year-on-year the picture is the same. Someone who didn’t know one province raised its minimum wage by 20% would not be able to tell which of the two it was.
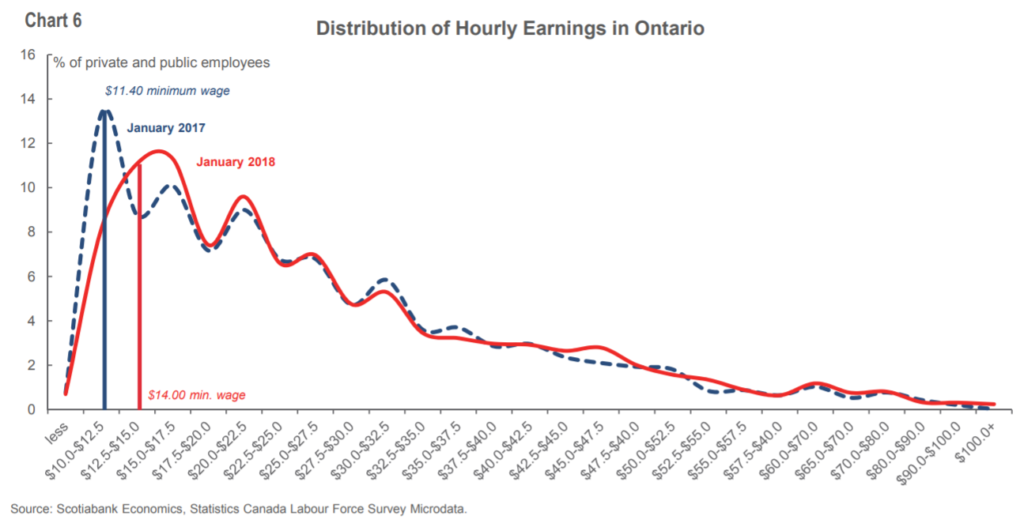
To their credit, some private sector economists vocally rebutted any links of the minimum wage to the monthly job numbers. A mid-February research note from Scotiabank was crystal clear: “There is no discernible evidence of a minimum–wage impact on hours worked in Ontario so far.”
So even given the more positive picture in the February data released yesterday, I’m waiting for a longer time period to look at the impacts of Ontario’s minimum wage increase on jobs and worker incomes. Remember that the latest research suggests workers should see a big net benefit. For now, I’m buoyed by this chart from the same Scotiabank report showing Ontario’s wage distribution shifting to higher wages at the low end and flattening:

While the latest jobs data doesn’t tell us much about the impact of Ontario’s minimum wage hike, it reveals much about substantial and persistent wage inequality. A few weeks ago, US analyst Doug Henwood wrote an excellent post showing how the big gains in US wage data that were responsible for setting off a stock market correction in February applied largely to the managerial class rather than to most workers. While overall wage growth looked to be a robust 2.9% overall in January, it remained flat at around 2.5% for the 80% of non-supervisory workers, spiking to nearly 4% for managers. These monthly numbers are part of a medium-term trend: over the past year and a bit, wage growth for supervisory workers outpaced that for non-supervisory workers and that gap has widened to over a percentage point in year-over-year growth (though as Doug pointed out on Twitter, February’s numbers have seen a reversal of this trend; the question is how permanent it will be).

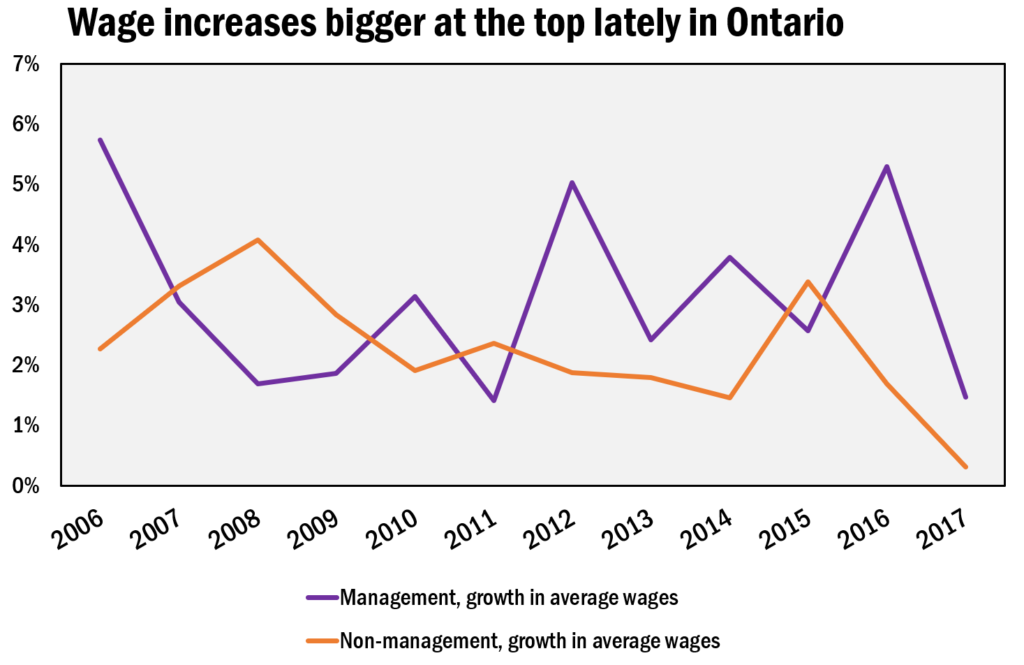
Statistics Canada helpfully includes types of work in the same monthly Labour Force Survey that caused panic about the minimum wage. The “managerial” category currently includes about 8% of all workers in Ontario. Average wages for this small group grew by a whopping 6% between January 2017 and January 2018. They grew by an even greater 6.9% between February 2018 and the same month last year.
This spectacular growth for an elite minority was big enough to drive growth in average wages for all workers to levels even higher than in the US. Overall wage growth was 3.4-3.5% year-over-year in January and February, or well above inflation. But this number shrinks down to just over 2% (2.1% in February) once managers are taken out of the mix. The bottom 90% of workers who are not management are continuing to see relatively stagnant wages that are only barely keeping up with inflation.
However, because monthly data can be so volatile, it’s good to also take a look at broader trends in Ontario to see if these recent numbers are more than an anomalous blip.

Turns out they are not. The big increases early this year are higher than those experienced by either managers or other workers on average in 2017 but fit a general pattern that’s taken hold in Ontario over the past five years of significantly faster wage growth for managers than the rest of workers. The chart above shows managerial wages growing more slowly in the aftermath of the crisis but bouncing back since 2012 and consistently outpacing inflation and gains the rest of the labour force (except for a small reversal in 2015). Wages for most of the working class, on the other hand, have grown at a measly pace. And this with unemployment continuing to fall to very low levels.
The inequality so plainly evident in the data is just one more reason why raising the minimum wage is so important. Once the minimum wage reaches $15 per hour, a third of workers will have been affected and incomes directly boosted. It’s high time workers in the bottom half got a raise; lately, they’ve just been seeing those giving orders running further and further away.