I’ve been meaning to post something on a chart from a Fraser Institute report for a while but slept on it. The chart comes from Fraser’s annual Consumer Tax Report and is supposed to show the different paths taken by how much households pay in taxes and how much they spend on basic goods like food and housing. 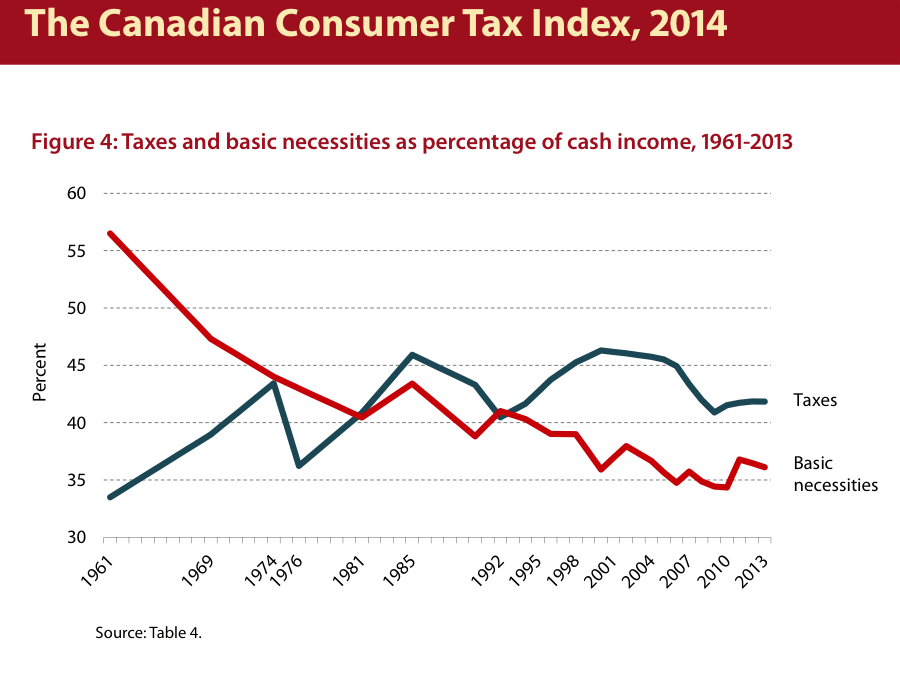
In one way, this chart represents a good news story for the right. Capitalism is fulfilling one of its major promises: the cost of the basic goods is decreasing relative to household budgets – in the aggregate, which given an increasingly unequal distribution of income means that many budgets feel this very differently. Not only that, but the welfare state is slowly shrinking. Looking closely at the chart (showing the Fraser Institute’s version of the data), we see that the relative tax take is falling since about the turn of the millennium. Of course, the chart is riddled with errors (in short, the Fraser Institute either uses too many taxes or too little income in its measures) but better OECD data shows roughly the same trend, at least for taxes.

Ironically, while a story about lower spending on necessities could be a success story (capitalism works!), of course, that’s not the point of the exercise. Instead, the chart is intended to incite anger about taxes. The big caveat being to ignore the services these taxes actually pay for: the much-lower tax bill from 50 or 60 years ago is before universal healthcare, the Canada Pension Plan and other major elements of Canada’s welfare state. Yet in its ideological fervour, the Institute might be on the right track, because what the chart shows is in fact not just a success story but the changing nature of consumption. It illustrates how what economists once called the “subsistence wage” – where subsistence is not like a fixed number of calories, square feet and so on but culturally-relative and so varies according to time and place – has changed: most strikingly, what part of consumption is privately-provided and what part is socialized and provided by the state.
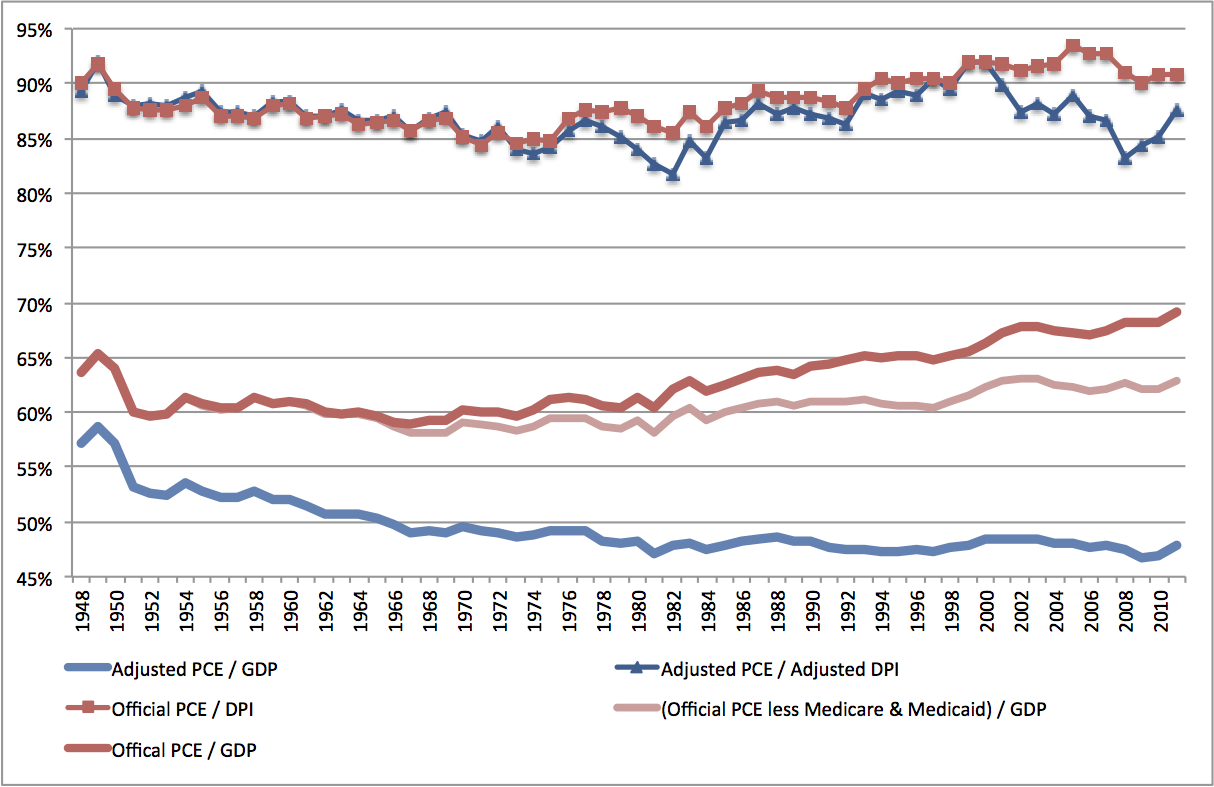
This opens up the question of what exactly has happened to consumption over the past half-century – during the rise, peak and on-going slow decline of the social democratic welfare state. In the US, JW Mason has a great post that sums up a recent paper showing that households may not actually have not seen the rise in private consumption that is often assumed to have taken place since about 1980, one that would jive with the negative turn in social democracy’s fortunes. Taking apart and adjusting consumption spending data, two economists from the Federal Reserve found that the apparent increase in household consumption seen in the official US data is actually cancelled out by a number of factors, primary among them house price inflation and increased spending on healthcare, neither of which are experienced as “cash flow” transactions by most households. For most, the boss or the government pays for health insurance that then pays for health services; also, those who own homes (still the majority in both the US and Canada) and don’t participate in buying/selling just live in a house that gets more expensive. Rather than following the dark red line, consumption measured as actual transactions you participate in has followed the blue:
I took a stab at carrying out a similar adjustment for Canada – one that is, to say the least, very barebones and a bit imprecise. Still, simply taking out the increase in owner-occupied house prices and some implicit (again, not actually a cash flow to/from households) financial gains, a somewhat similar picture begins to emerge. 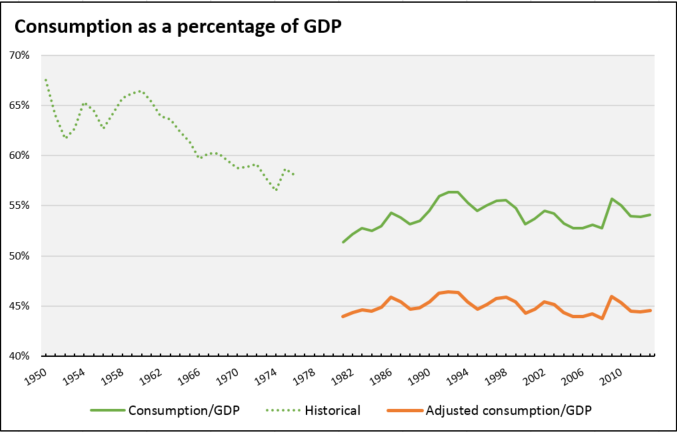
For the data wonks: a better comparison would come from diligently going through the national accounts and picking out all elements of non-cash flow consumption (as the US team did) and finding a way to calculate these (including implicit housing “rents”) from the historical statistics. In short, what emerges from the US comparison are two things:
- The obvious point that Canada does indeed have a slightly larger welfare state that provides more non-cash consumption than the US – that a bit more of our economy is socialized. (Even with the partial adjustment, adjusted consumption expenditure is lower than the US as a percentage of GDP and the additional adjustments would only lower it further.)
- More interestingly, the adjusted data shows that, like in the US, consumption expenditure is stable in proportion to the size of the economy rather than rising ever so slowly as the official data would indicate. (The difference is much less pronounced in Canada: the unadjusted data rises slightly (3% between 1981 and 2013 though fluctuating in between), while the adjusted data is indeed very stable.) JW puts out the claim that this dispels parts of the common financialization story about the economy. Households were not taking on debt to finance more consumption but racking it up purely due to “disinflation and higher interest rates.” A Canadian story would have to take into account the major fluctuations in our exchange rate as well. Altogether, a kind of detente between privatization and decommodification but with more debt for workers.
I’m interested in grappling with whether this second point is correct, but perhaps even more interested about what this all says about exactly how consumption is today divided between the private and the socialized spheres, what changes have taken and are taking place in this mix, how we have experienced these changes and how those like the Fraser Institute are able to weave a popular privatization story out of it all. More pointedly, this comes back to the same questions about the legacy and viability of the post-war welfare state that the last crisis has brought forward much more sharply. So while our capacity grows, we still work long to insane hours while others don’t work at all, the socialized sector limps but no longer expands and our imagination of political possibility is similarly shriveling.
This is fertile ground for the Fraser Institute, for whom “privatize!” is the agenda and taxes are the shorthand. And although this anti-tax rhetoric actually illustrates some of “managed” capitalism’s success, it still eggs on a breakdown of the socialized economy that has been trumpeted ever more loudly since the 1980s. Even taking the Fraser’s graph on its own silly terms could move quickly to the possibilities that satisfaction of necessities leaves for socialization, but the opposite happens: “what next can we privatize?” That this is the seeming natural interpretation raises the hard and important question: on what terms could a reversal of basic slogans – from privatize to socialize – take place?