Categories
Canada Investment Tax

“Investment” versus investment

Surprise! A new investigation by the Toronto Star and the CBC found that recent treaties with tax havens like the Bahamas and Panama aimed at more “transparency” have just made it easier for corporations to evade ever more taxes. And Canadian corporations have obliged this golden opportunity. “Investment” abroad has ballooned all the while the taps on actual investment at home have run dry.

Signed under Stephen Harper and left untouched under Trudeau, Tax Information Exchange Agreements (or TIEAs) allow corporations to funnel profits through notoriously low-tax jurisdictions. For example, if a corporation only has an office in, say, Panama (of Panama Papers fame), it can pay zero taxes on profits and have the option to repatriate the money back to Canada tax-free. Here’s how the Star report describes it:

“TIEAs are a well-meaning but failed idea,” said Arthur Cockfield, a professor of tax law at Queen’s University who warned the government of the TIEAs potential for abuse.

“I don’t blame the companies. It’s kind of like a Christmas present sitting under the tree. What are you going to do, not open it?”

…Many of the leading corporations on the Toronto Stock Exchange now have a presence in tax havens and use Canada’s treaties to dramatically reduce their tax bill at home. One company, Gildan, reduced its taxes by more than 90 per cent in 2015 (see sidebar).

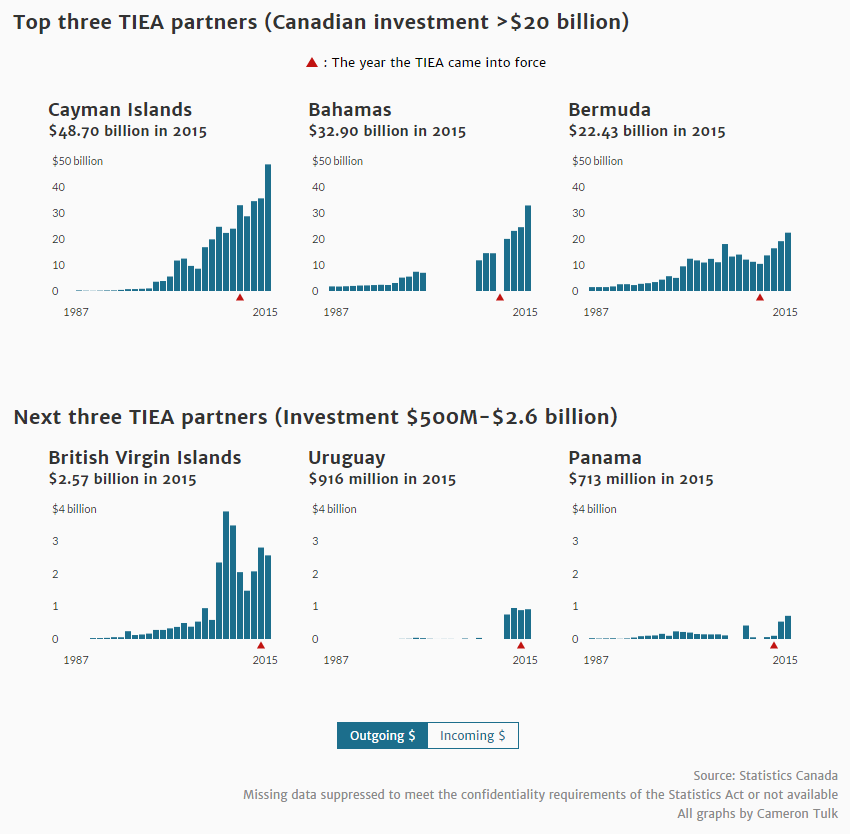
TIEAs have had a dramatic effect on offshore investment, and Canadian money stashed in tax havens is piling up rapidly.

Compare data on foreign direct investment in six major tax havens with charts showing a few measures of investment at home. Here’s “investment” abroad growing rapidly…

tax haven fdi

…and total investment, including that done by government, at home:

capex cda

The chart above is in nominal dollars and includes all investment to make it easier to compare to the first chart. Here’s just business non-residential investment as a percentage of GDP. The uptick due to the resource boom in the early 2000s is clear; it’s instructive to imagine what things would have looked like if the resource sector had continued to expand at it’s long-term pre-boom average.

biz gross capform

And finally, take a look at corporate tax receipts:

corp tax

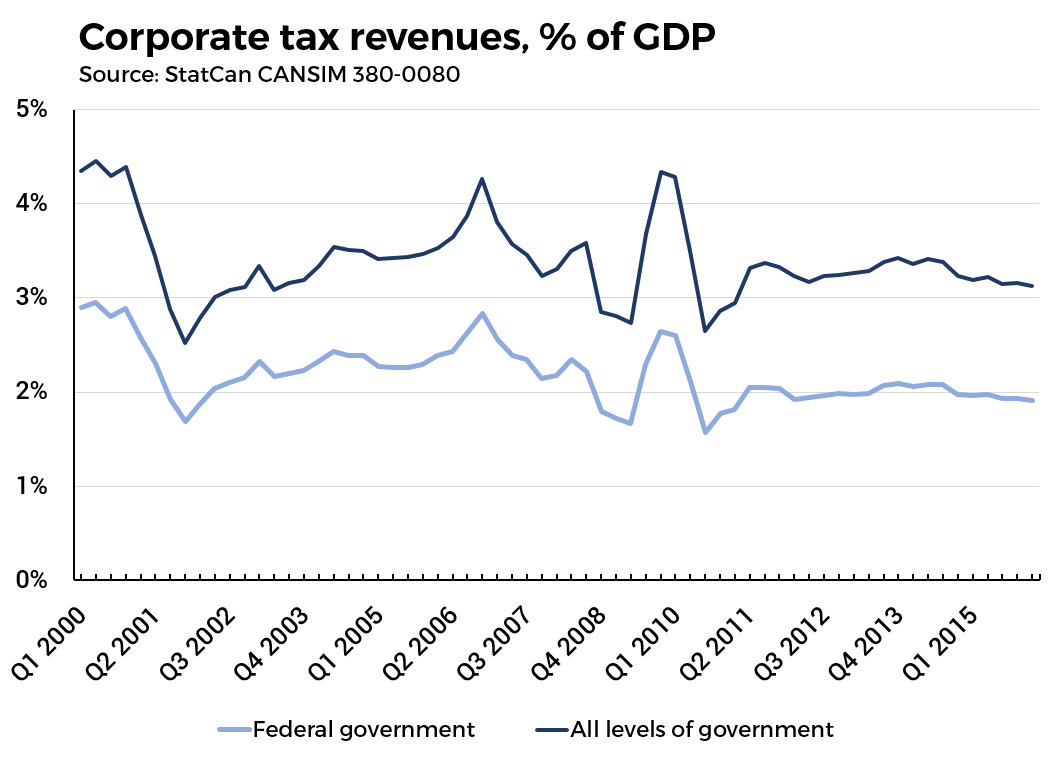
The contrast is striking. Corporations are piling cash into off-shore accounts while paying less in tax and barely keeping up with investment, especially outside the resource boom. Apologists would love to have a debate about the finer points of tax incidence, that is who ultimately pays a tax. They have a point; however, if it were so easy to always fully pass taxes on to consumers, why would corporations go to all the trouble of lobbying for tax breaks and making tax evasion so much easier? The answer is that it is ultimately a question of power. There is a question of how social wealth is divided up in the final accounting, but it comes down to who has the power to influence the division. Treaties with tax havens are just one instrument in the quiver.

A key and related next step would be to draw the links to the shareholder value revolution that has sought to remake corporations into ATMs for the wealthy. Rather than reinvest their profits into growth and productivity enhancements, corporations have, since roughly the early 1980s, been under increasing pressure to return a vast chunk of profits to shareholders via share buybacks and dividends. The corporate sector in the US is the poster child for the extract-what-you-can model but it turns out, for example, that a similar logic also played no small role in breaking the Eurozone financial system after the last crisis. What kind of tangible links are there between tax evasion and shareholder value for Canadian corporations?

In fact, when Mark Carney initially coined the “dead money” meme that has become an omnipresent shorthand on the left, he was not only exhorting corporations to invest. If they couldn’t, Carney said they should dish out more money to shareholders instead. Profits can pile up in bonds, shareholder pockets, cash or offshore accounts—the reality is that corporations are strategically choosing between competing allocations of assets, not stashing cash under a rug. Corporate money is never dead, and much of it is alive and well relaxing in Panama and the Bahamas. One thing is certain, it isn’t working for the rest of us.

Categories
Austerity Canada Tax

Transfers, taxes and who pays for austerity

The question of who pays for austerity and how is an enormous one. Promoters of austerity often claim that cuts to universal services are fine if they’re offset by transfers to those who can’t pay for newly-marketized services. The same goes for expanding services – why give everyone childcare if you could just give those at the bottom the money to pay for it the same as those who can afford it?

There are many arguments for why services should be public and universal that do not simply rely on whether everyone is able to pay for them privately. However, even on their own terms, the argument for ramping up transfers to the bottom of the income distribution hasn’t held up in recent times.

I was intrigued by a post from Matt Bruenig that compares the US and Finnish tax and transfer systems, arguing that while the Finnish system looks less progressive by some measures, this is due precisely to higher and universal transfers. I’ve been looking at lots of data on the latest phase of austerity in Canada that began at the federal level with the election of the Chretien Liberals in 1993. Here, I’ll steal some of what Matt does and apply it to the Canadian tax and transfer system since then.

For starters, here are average gross government transfers by quintiles in Canada. This is how much money people receive in the form of cash benefits and credits from all levels of government. This is thus only a rough picture of what’s happened at the federal level, but most transfer income is federal. The first chart is for 1993 and the second is for 2011 (the last year of publicly-available data); everything is adjusted for inflation to constant 2011 dollars.

150402 Govt transfer 1993

150402 Govt transfer 2011

What’s striking is how similar the two charts are. While the economy has grown – 35% growth in real GDP per capita between 1993 and 2011 – government transfers have essentially stagnated for everyone. The bottom 40% have actually lost in transfer income and only the fourth quintile saw any kind of sizeable increase gaining just above 10%.

Next, let’s add income taxes into the mix. Here are the same two charts, but this time showing net government transfers. This is the difference between the transfers above and income tax paid to all levels of government.

150402 Net transfer 1993

150402 Net transfer 2011

Again, we have little change over almost two decades except for a lower net transfer to the richest 20%, though this is likely a reflection of the growing inequality in market incomes, especially higher top incomes (and hence higher income taxes). Remember too, that this shows a more progressive structure than if we took all taxes including those on consumption as well as user fees (again, paying more with stagnant transfers) into account. This total tax structure is far less progressive – somewhat regressive even in some provinces.

Here is another way to look at the changes in same net transfer data, showing the trends in time over the entire 1993-2011 period.

150402 Net transfer series new

We can divide what’s happening into a few distinct periods at the federal level (provinces do more direct spending). Clearly visible are

  1. a main phase of Liberal austerity from 1993 and 2000,
  2. a short upturn after the 2000-era tax cuts (since net transfer = gross transfer minus taxes, a reduction in tax means the net transfer goes up)
  3. a general stabilization since then, only punctuated by
  4. the fall in incomes and short-term fiscal expansion after the 2008 crisis (with a clear trend back to the stabilization or lower in the last years of data).

Finally, here is a last chart that takes net transfers and divides them by market income. That is, it shows what percentage of market incomes is received on average by each quintile as net government transfers.

150402 Net transfer percentage series

This last chart is combines the picture of growing inequality with transfer stagnation. Economic growth is not translating into shared resources, whether in the form of existing or much-needed new public programs or even simply being pooled for redistribution. This certainly points to austerity falling disproportionately on the backs of the poorest.

Note: all data comes from Statistics Canada, CANSIM Tables 202-0703 and 202-0704.

Categories
Ideology Privatization Tax

Some thoughts on social democracy starting from a Fraser Institute graph

I’ve been meaning to post something on a chart from a Fraser Institute report for a while but slept on it. The chart comes from Fraser’s annual Consumer Tax Report and is supposed to show the different paths taken by how much households pay in taxes and how much they spend on basic goods like food and housing. 141209 fraser chart

In one way, this chart represents a good news story for the right. Capitalism is fulfilling one of its major promises: the cost of the basic goods is decreasing relative to household budgets – in the aggregate, which given an increasingly unequal distribution of income means that many budgets feel this very differently. Not only that, but the welfare state is slowly shrinking. Looking closely at the chart (showing the Fraser Institute’s version of the data), we see that the relative tax take is falling since about the turn of the millennium. Of course, the chart is riddled with errors (in short, the Fraser Institute either uses too many taxes or too little income in its measures) but better OECD data shows roughly the same trend, at least for taxes.

141209 canada tax-gdp

Ironically, while a story about lower spending on necessities could be a success story (capitalism works!), of course, that’s not the point of the exercise. Instead, the chart is intended to incite anger about taxes. The big caveat being to ignore the services these taxes actually pay for: the much-lower tax bill from 50 or 60 years ago is before universal healthcare, the Canada Pension Plan and other major elements of Canada’s welfare state. Yet in its ideological fervour, the Institute might be on the right track, because what the chart shows is in fact not just a success story but the changing nature of consumption. It illustrates how what economists once called the “subsistence wage” – where subsistence is not like a fixed number of calories, square feet and so on but culturally-relative and so varies according to time and place – has changed: most strikingly, what part of consumption is privately-provided and what part is socialized and provided by the state.

Categories
Canada Inequality Tax

Forget income splitting, tax the rich!

For now, I’ll keep double-posting my pieces for Ricochet here. The latest is on income splitting and taxing the rich more generally. The idea is that even though taxing the rich won’t get generate huge revenue, there are lots of other good reasons to do it, like even just slightly shifting the balance of power in the workplace. On the flip side, the income-splitting tax cut does more than just funnel money disproportionately to the rich, it also reinforces 1950s-style gender roles. Here is the piece in full:

Tax may not to be a four-letter word, but neither is it a one-trick pony. Rather than merely being tools to raise government revenue and redistribute income, taxes can affect the distribution of power in the home and at work.

The tax reform centrepiece just introduced by the Conservatives not only cuts the government’s ability to raise revenues, it is also openly touted as a way to reinforce the 1950s nuclear family. Instead of cutting taxes on the wealthy to make the home more unequal, let’s tax them to get some power back in our workplaces.

Leave it to income-splitting Beaver

First, a quick recap. There are two major pieces to the Conservatives’ most recent “tax reform”: income-splitting, or the Family Tax Cut (FTC), and the extension of the Universal Child Care Benefit (UCCB). Income-splitting is a tax cut that allows families where one person earns more to share income with their partner to lower the overall tax bill. Benefits from this are very disproportionately going to go to families earning above the national median.

The extension of the UCCB is an additional cash transfer, although limited to those with children – in other words, new government spending. The upside? It boosts the incomes of the working and middle classes. The downside? It doesn’t satisfy fans of targeted transfers, as it also benefits the wealthy thus wasting resources and it doesn’t satisfy fans of universal programs because it benefits the rich without getting their support for high-quality public services.

Categories
Canada Inequality Tax

Is Canada the Sweden of anything?

There was an odd article last week on the explainer site Vox that argued Sweden doesn’t achieve its relative equality with very progressive, “soak the rich” taxation. While Matt Bruenig and Mike Konczal have already provided excellent, US-centred rebuttals to this argument, I thought this would be a good occasion to take a look at some comparative facts about Canadian inequality and overall redistribution.

First, notice that on the chart in the original article, Canada is very close to the US, as being among the “least redistributive”. This goes against the national image of a kinder, gentler capitalism more akin to the various North European countries clustered around the middle and top of the chart.

Source: Vox.
Source: Vox.

The chart, however, is based on an odd measure of redistribution: the percentage of total income tax paid by the richest households (the Vox article doesn’t specify exactly, but it could be this OECD measure of tax revenue paid by the top 10%).  As Bruenig and Konczal both point out, defining the degree of redistribution like this has many problems: for example, it can make a very unequal society with low and flat(ish) taxes appear to be much more redistributive than a fairly equal society with high and progressive taxes. In many ways, the Vox article is simply measuring the degree of inequality in multiple ways rather than relating it to tax progressivity.

In light of this, what does it mean that Canada is right down there clustered with the US as a country that supposedly taxes progressively but doesn’t redistribute? Is this something the chart nevertheless gets right? Is it that while Canada is often presented a kinder, gentler state that can be set alongside its Northern European counterparts (themselves no absolute paragons and eroding slowly), the gap between it and the US is really not that wide?

Categories
British Columbia Climate change Tax

Where’s the tax in BC’s carbon tax?

British Columbia’s carbon tax has been getting some high praise lately. A recent article in the Atlantic called it “the crown jewel of North American climate policy”. Such assessments need some tempering. BC’s carbon tax can tell us important things about the limits of fiscal policy today, which in turn questions the potential it has for fostering significant environmental change.

Tales of the tax’s effectiveness focus on its environmental impacts. Almost six years since its introduction, it is indisputable that the carbon tax has had some impact on resource use and emissions. This is clearly a good thing. There is debate about the extent of this impact and where it is concentrated but it’s there – see these charts.

The carbon tax is presented as not being as problematic as other “market-friendly, eco-friendly” measures such as cap-and-trade. These end up being largely corporate giveaways – new sources of commodification and profit. BC’s carbon tax has been hailed as a policy that rather than giving money back to corporations brings revenue back to the people.

Yet as opposed to those who make the carbon tax out to be an unqualified success, I think any hurrah-optimism needs to be seriously qualified.

Categories
Canada Government Tax

Ontario is no California when it comes to debt

The Toronto Star just published an article I wrote in response to claims made by the Fraser Institute and the Toronto Sun that Ontario has a runaway debt problem worse than California’s.

The short version: I call BS. The slightly longer version: California has constraints, such as limits on the size of debt and difficulties in raising new taxes, that have severely hampered its ability to take on and manage debt. It has a smaller debt than Ontario on all measures but much worse credit standing. Ontario, on the other hand, still has a lot of flexibility to deal with debt. The “solutions” proposed along the Fraser Institute’s alarmism actually seek to create similar, harmful constraints in Ontario. “There is no alternative” becomes true only if we allow alternatives to be removed.

Read the full piece here.

Categories
Economic history in the present Tax

Economic history in the present: Potlatch and tax

This post inaugurates an occasional series I’m calling, “Economic history in the present”. This series will look at vignettes from global economic history with an eye to current phenomena or particular events. Some will be more speculative, drawing on anthropology and philosophy; some will be more rigorous. Hopefully, both aspects of this approach will produce interesting juxtapositions that illuminate the present via the past. Without further ado, here is the opening salvo…

 ♠   ♣   ♥   ♦

While redistribution is a bit of dirty word today, it has been a key economic activity across human history. As resources move from the periphery of society to its centre through means more or less refined – from robbery and pillage to rents, taxes and tithes – the need arises for mechanisms to move some resources back from the centre to the periphery. Whether to pacify, reward or simply keep from starvation, the powerful have long given part of their take back to the powerless. Over the course of human history, the vehicles for redistribution have varied considerably: from the haphazard to the ritualized, from the simple to the elaborate.

potlatch-ceremony

One oft-cited means of redistribution comes from the lands now occupied by British Columbia. The Pacific Northwest of North America has a rich tradition of the potlatch, a highly complex, formal redistributive process frequently drawn upon by anthropologists. In ceremonies lasting from several hours to several weeks, wealthy and powerful leaders of kinship groups gave away their wealth to guests from the surrounding area that included members of their own group and often entire rival groups. The more that someone gave away, or even destroyed, the more prestige they garnered and the wealthier they became in the eyes of others – despite the fact that a potlatch might leave them temporarily near penniless. Social status was conferred via giving rather than having.

The potlatch with its ironic twist on wealth should not, however, be mistaken for some kind of utopic ritual; the powerful could give away so much precisely because they had the power to obtain it in the first place. Redistribution is fundamentally about restoring a semblance of social balance; the potlatch gift is a counterpoint to the potential and actual exploitation and violence inherent in the prior process of distribution. It points to redistribution as pivotal in keeping social peace and ensuring continued social cohesion and survival.